Every data point, every metric made simple in our report templates
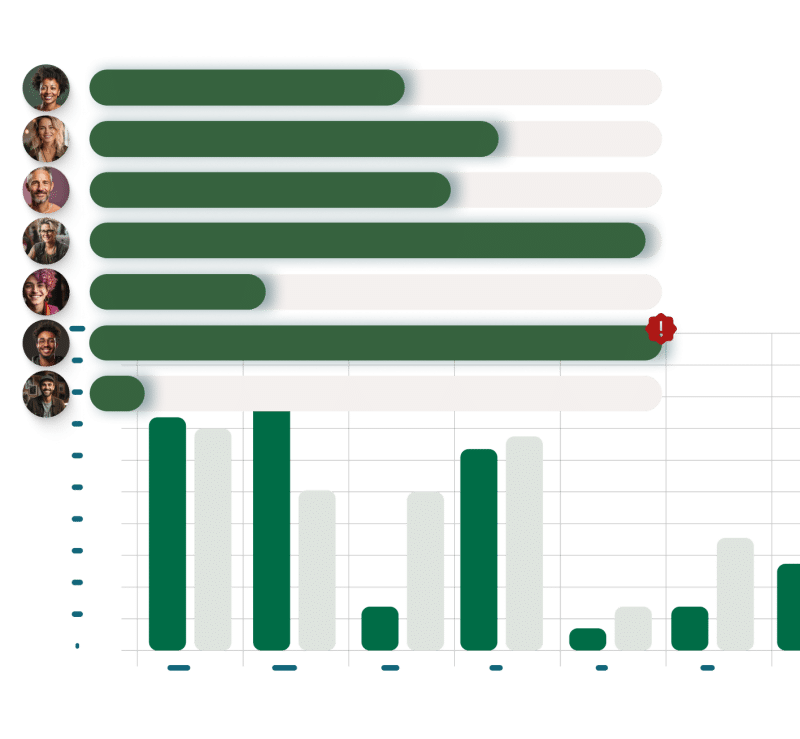
The Hub Planner report engine is very powerful and allows you to create simple and intuitive reports to aggregate all the data across all teams and projects.

Smart Report Templates for the Entire Team To Use
-
Intuitive Report builder allows you to generate unlimited combinations.
-
Built in filters allow you to get to the data quickly.
-
Add 100’s of columns to any report.
-
Save reports as custom to save time
-
Heat map reports to visualize data quickly
-
Save and export reports simply
Create efficient and quality reports with the intuitive smart reports home base. The responsive interface is a well balanced grid layout with distinctive easy to identify icons which leads to report templates.
Key Features of Hub Planner Reporting
Utilization Reports
Spend Tracking
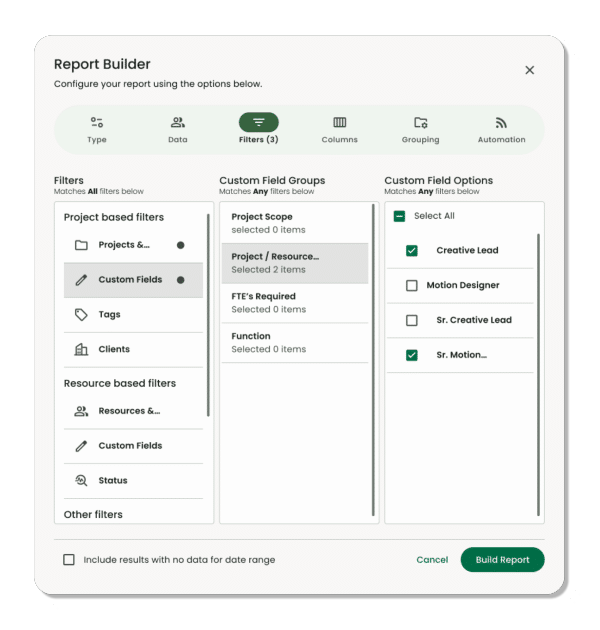
Report Generation Builder
Share and Save Reports
Save reports internally or just for yourself to view later.
Conditional Formatting
Budget & Profitability
Generate reports to track budget and profitability across all projects.
Want to learn more about resource management at Milient?
Easy to use Report Builder
Define the applicable criteria necessary and begin design. Select your report type followed by selecting the required report data metrics. There are 100’s of filter and column report options for you to choose from. Configure columns with a smart drag and drop facility to determine your report layout. This gives you maximum flexibility.


Fast Real Time Reporting
Reports are produced in real time with smart caching to optimize speed, providing powerful instant insights into Projects, Resources, Utilization, Spend and Budgets. Real time report information allows for making smarter and strategic decisions in future planning and forecasting.
Trusted by teams, rated by users

Hub Planner Reports FQA
What can I do with the Reports feature?
Hub Planner’s powerful report engine enables you to create a wide range of reports, from simple and intuitive to complex, that aggregate data across all resources and projects. You can use our pre-built templates or the report builder to create custom reports incorporating projects, resources, events, and unassigned work. Enhance your reports with charts and graphs, download them as Excel or CSV files, and easily share them with your team.
How does the report builder work?
The report builder allows you to generate various combinations of reports through a user-friendly interface. You can add and update various columns, create filters, select data, group information, and choose a date range to tailor your reports precisely to your needs.
What are the Report Templates?
We have pre-designed templates that your team can use to generate consistent and comprehensive reports. These templates cover various areas, including projects, resources, billing and spending, utilization, clients, heat maps, and unassigned work.
What are heat map reports?
Heat map reports visualize data quickly, helping you to easily identify patterns and gaps in your team’s utilization.
How many columns can I add to a report?
You can add all the columns you need to any report, allowing for detailed and comprehensive data analysis.
How can I track budget and profitability?
Our dashboards provide a clear view of your budget, project schedule spend, and reported spend when you are using the billing rate and timesheet extensions. Additionally, you can generate billing and spend reports to monitor budget and profitability across all projects and resources, offering valuable insights for financial management.
Book a demo
Get hands-on
Try out key features with our team guiding you step-by-step